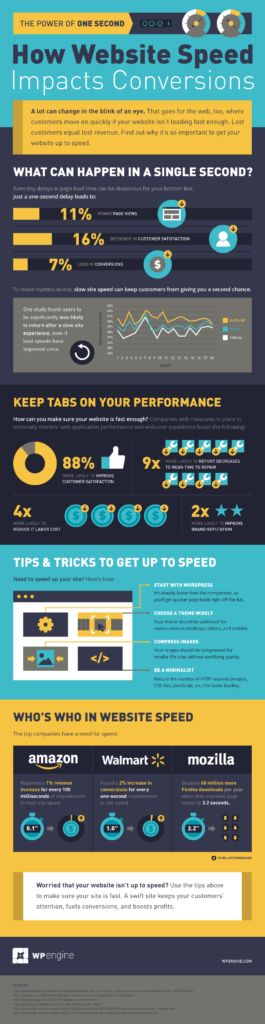
On the web, a delay of just one second can reduce page views, decrease customer satisfaction, and result in a loss in conversions. In this infographic, we look at how site speed impacts your bottom line and how you can ensure your site is speedy.
Learn more about site speed in our special report: 5 Super Simple Steps To Speed Up Your WordPress Site.
Want to know more about how site speed affects your business? Check out this ebook: Every Second Counts: How Page Performance And Speed Affect Your Business, And Your Bottom Line
I agree with all the stats. Once i removed CDN from my site for few weeks and our traffic declined by a good number. Bounce rates also increased. After researching a bit we came to know that speed is the culprit. Thanks for this nice infographic, i’m sharing it for others to get benefited.
At the bottom of the infographic it says Mozilla increased downloads after increasing page load time, is this a mistake?
Thanks Jamie. Yes, that was a mistake and has been fixed.
what are the best tools your recommend to check your site speed and monitor when the site goes down?? Pingdom?
Pingdom is good for benchmarking and tracking performance load times. Uptime Robot is good for monitoring uptime… but it doesn’t monitor DNS uptime (or didn’t, as of last fall), so you’ll need a separate solution for this.
If you’re on a P1 or E1 with WPEngine, install New Relic.
It’s really interesting to see how much more important speed/performance are becoming for websites. It would be good for this infographic to be extended to show how speed affects search engine position, as it’s an increasingly important factor in search engine algorithms as well as affecting user experience.
Good article.