As discussed in my last post about Data Visualization, infographics can be extremely useful tools for representing raw data in a visually striking form. But sometimes, they can also be a jumbled, confusing, and misrepresenting mess!
Let’s take a look at some of the common mistakes found in bad infographics around the Internet.
Mistake #1: Bad Math
The infographic below seems informative enough. The self-perceptions of “Baby Boomers” could potentially be an interesting data set to visualize. The problem, however, is that this graphic represents 243% of responses. You don’t have to be a mathematics major to see what is wrong with an aggregate response of 243%.
This is not necessarily indicative of faulty data. Rather, it is a poor representation of the data. It would have been more effective to display the phrases individually, with size determined by percentages. This way the viewer could compare the phrases to each other more easily. Removing the percentages from a single body also clarifies that the percentages aren’t mutually exclusive.
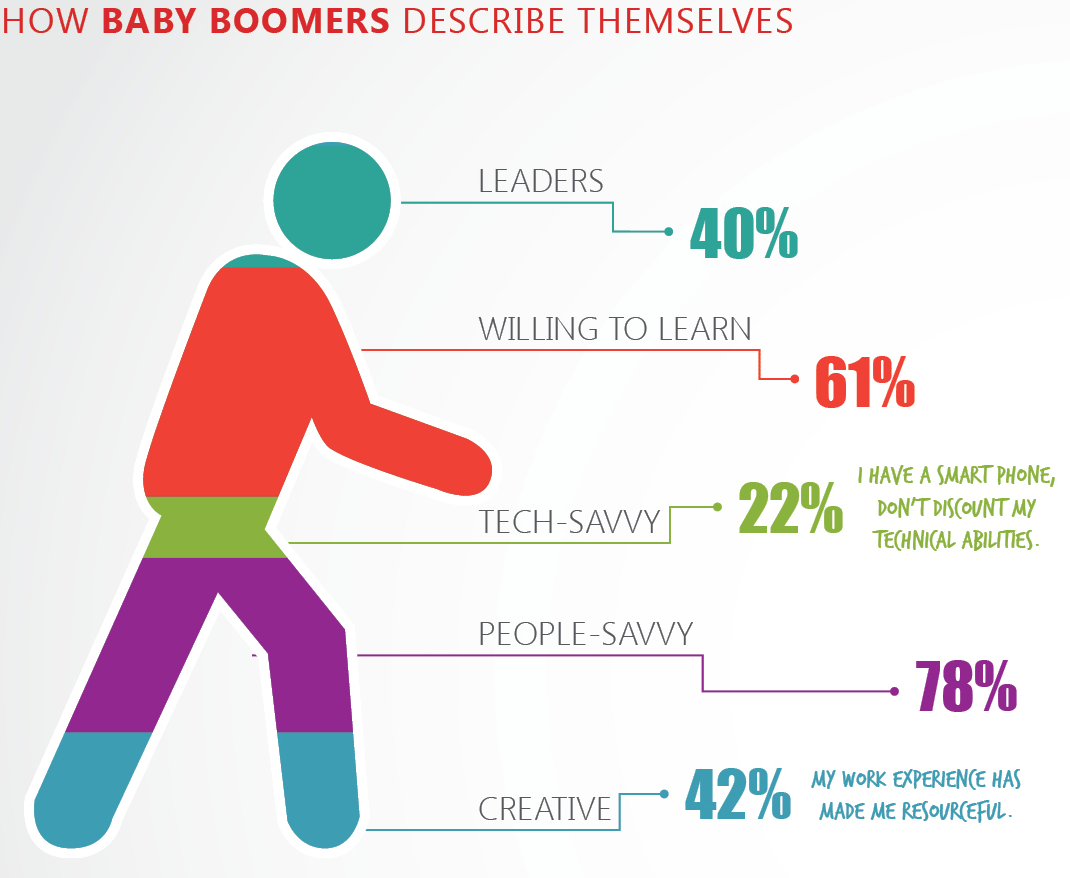
Source: WTF Vizualisations
Mistake #2: Confusing graphs
Some infographics have fantastic data, but miss the mark when it comes to representing it in an easy-to-understand format. Such is the case with the graph below.
The information is relevant and the content seems accurate enough, but the pie chart is much too confusing. Because of the 3D representation and spiraling of the pie, the widths of the pie pieces—which represent the different percentages—are difficult to differentiate. By displaying the smaller wedges higher than the larger chunks of the pie, the point the author was trying to communicate is misconstrued.
Removing the 3D splaying of the individual parts of the this pie chart would help the viewer to contextualize how much each point of the TED Talk is actually worth, relative to the others. A traditional flat pie chart might be a better representation of this data.
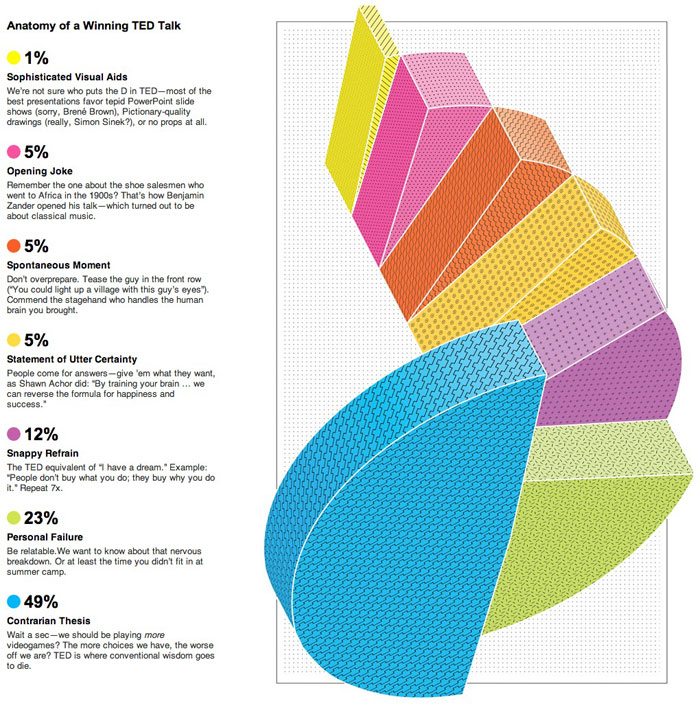
Source: Design Your Way: When Infographics Go Bad Or How Not To Design Data Visualization
Mistake #3: Too Much Information
Biting off more than you can chew when it comes to infographics can be a killer. If you publish a jumbled mess of a graphic— viewers will skip it, try to decipher it and get frustrated, or a combination of the two. I suspect that’s what happens when people look at the infographic below. Try to represent your data in the simplest way possible to avoid this.

Source: Design Your Way: When Infographics Go Bad Or How Not To Design Data Visualization
Go Forth, and Create Beautiful Graphs!
Now that you know a few data visualization pitfalls to avoid, start creating your own infographics with these tools in mind. Remember, the whole point of an infographic is to:
- Collect interesting and relevant data
- Display the data in a coherent manner
- Make the infographic aesthetically appealing
- Reveal a truth or make a point in a more compelling way than simply stating it in words—which requires you to choose the most effective infographic type available!
If you keep those in mind, and avoid the mistakes above, you will be well on your way to wowing your audience with amazing data visualization.
Any other pointers to remember when creating an effective infographic? Let me know by leaving a comment below!
Not one recommendet Programm for build a infographic? Top secret?