
Content Performance is a WP Engine plugin that integrates your raw data from Google Analytics and optimizes it for WordPress, to help marketers and publishers better understand how their content is performing among real users on their sites. Content Performance is available as an add-on for Startup, Growth, and Scale plans, and is included for Business plans and higher.
How to install Content Performance
If Content Performance is available for your account, you will be able to install the plugin in your User Portal, by navigating to the Installs > Utilities page. Click to Install Content Performance on your WordPress install, and you will be guided through the setup and configuration process. For more information on how to configure the plugin, please see Configuring Content Performance.
How to access Content Performance
Content Performance is a WordPress plugin that lives in your WordPress Admin Dashboard. After the initial configuration process, you can access Content Performance via the following steps:
1. Log in to the WordPress Admin Dashboard for your site
2. Locate the Content Performance tab on the left navigation Content Performance > Dashboard.
Content Performance will automatically pull data from Google Analytics for the past year, and update with new data every day. From here you can use the date picker and menus to customize the dashboard to the data you want to see.
Why Use Content Performance?
Content Performance is created with publishers and marketers in mind. Using Content Performance can help your team strategize more easily for promoting and creating WordPress content. Below are a few key ways teams have utilized this tool.
Example Uses
- Optimize content relevance to increase audience engagement, conversion, and revenue partnerships.
- Plan your content calendar by understanding which topics are getting traction or require a refresh.
- Improve call to action for high-performing content to drive signups or conversions.
- Repurpose popular content and categories into ebooks or whitepapers.
- Improve content for posts with high bounce rates.
- Adjust author assignments based on user page views or engagement levels.
- Track overall performance/growth of your publication over time.
Key Features
Content Performance can help your team better understand which content on your site is performing best among real users, and how to improve the pages that are not performing well. Some highlighted features which you can easily view:
Most Popular Content
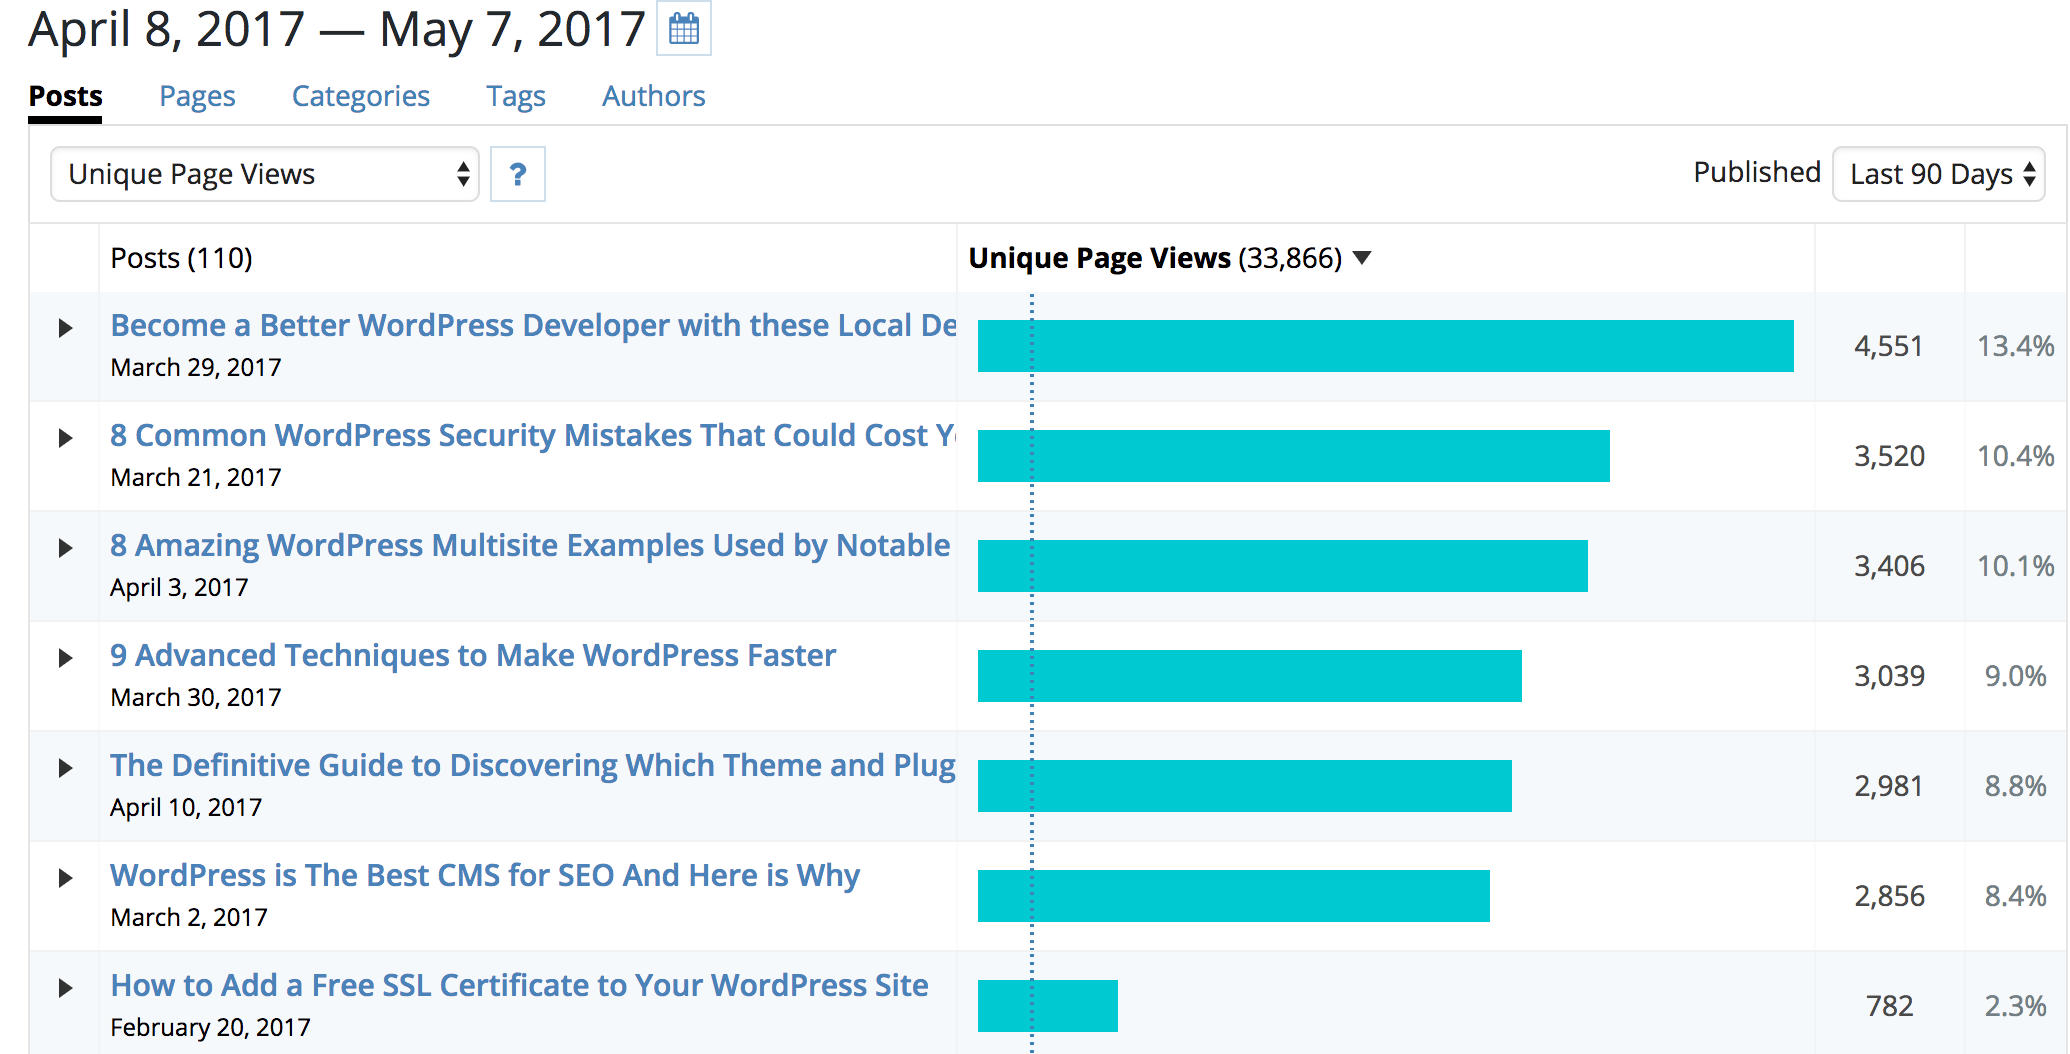
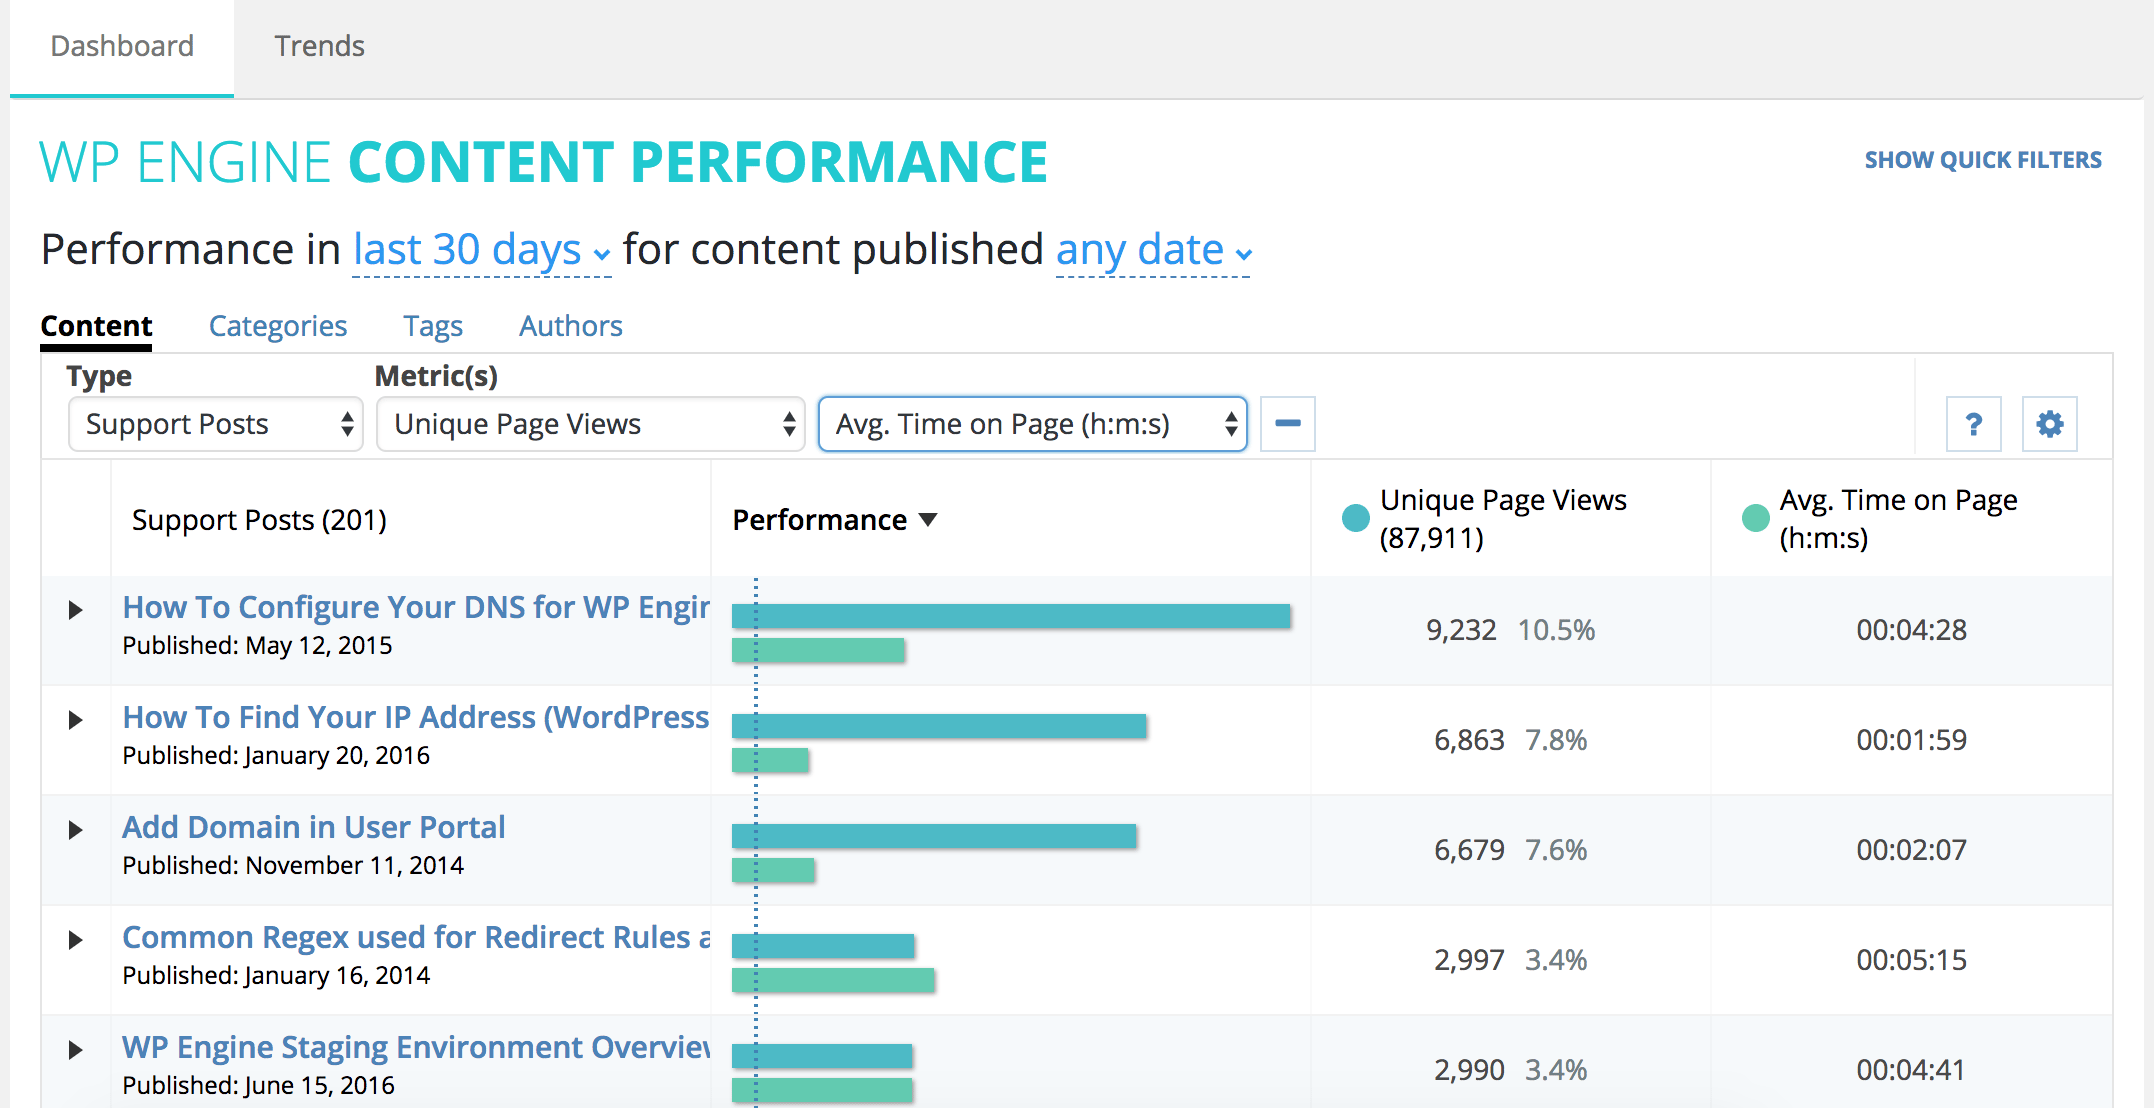
Select “Posts” or “Pages” in the top navigation, then “Unique Page Views” from the dropdown menu to see which content is receiving the most traffic from unique visitors to your site. This is a good gauge of how popular your posts and pages are with real users.
Content with Lowest Bounce Rate
Select “Posts” or “Pages” in the top navigation, then “Bounce Rate (%)” from the dropdown menu to see which content has the lowest bounce rate, indicating the content is fast and engaging.
Authors with Most Successful Content
Choose “Authors” in the top navigation, then “Unique Page Views,” “Sessions,” or “Bounce Rate (%)” from the dropdown menu to see which authors are creating the most content or drive the most engagement for your users.
Most Useful Tags
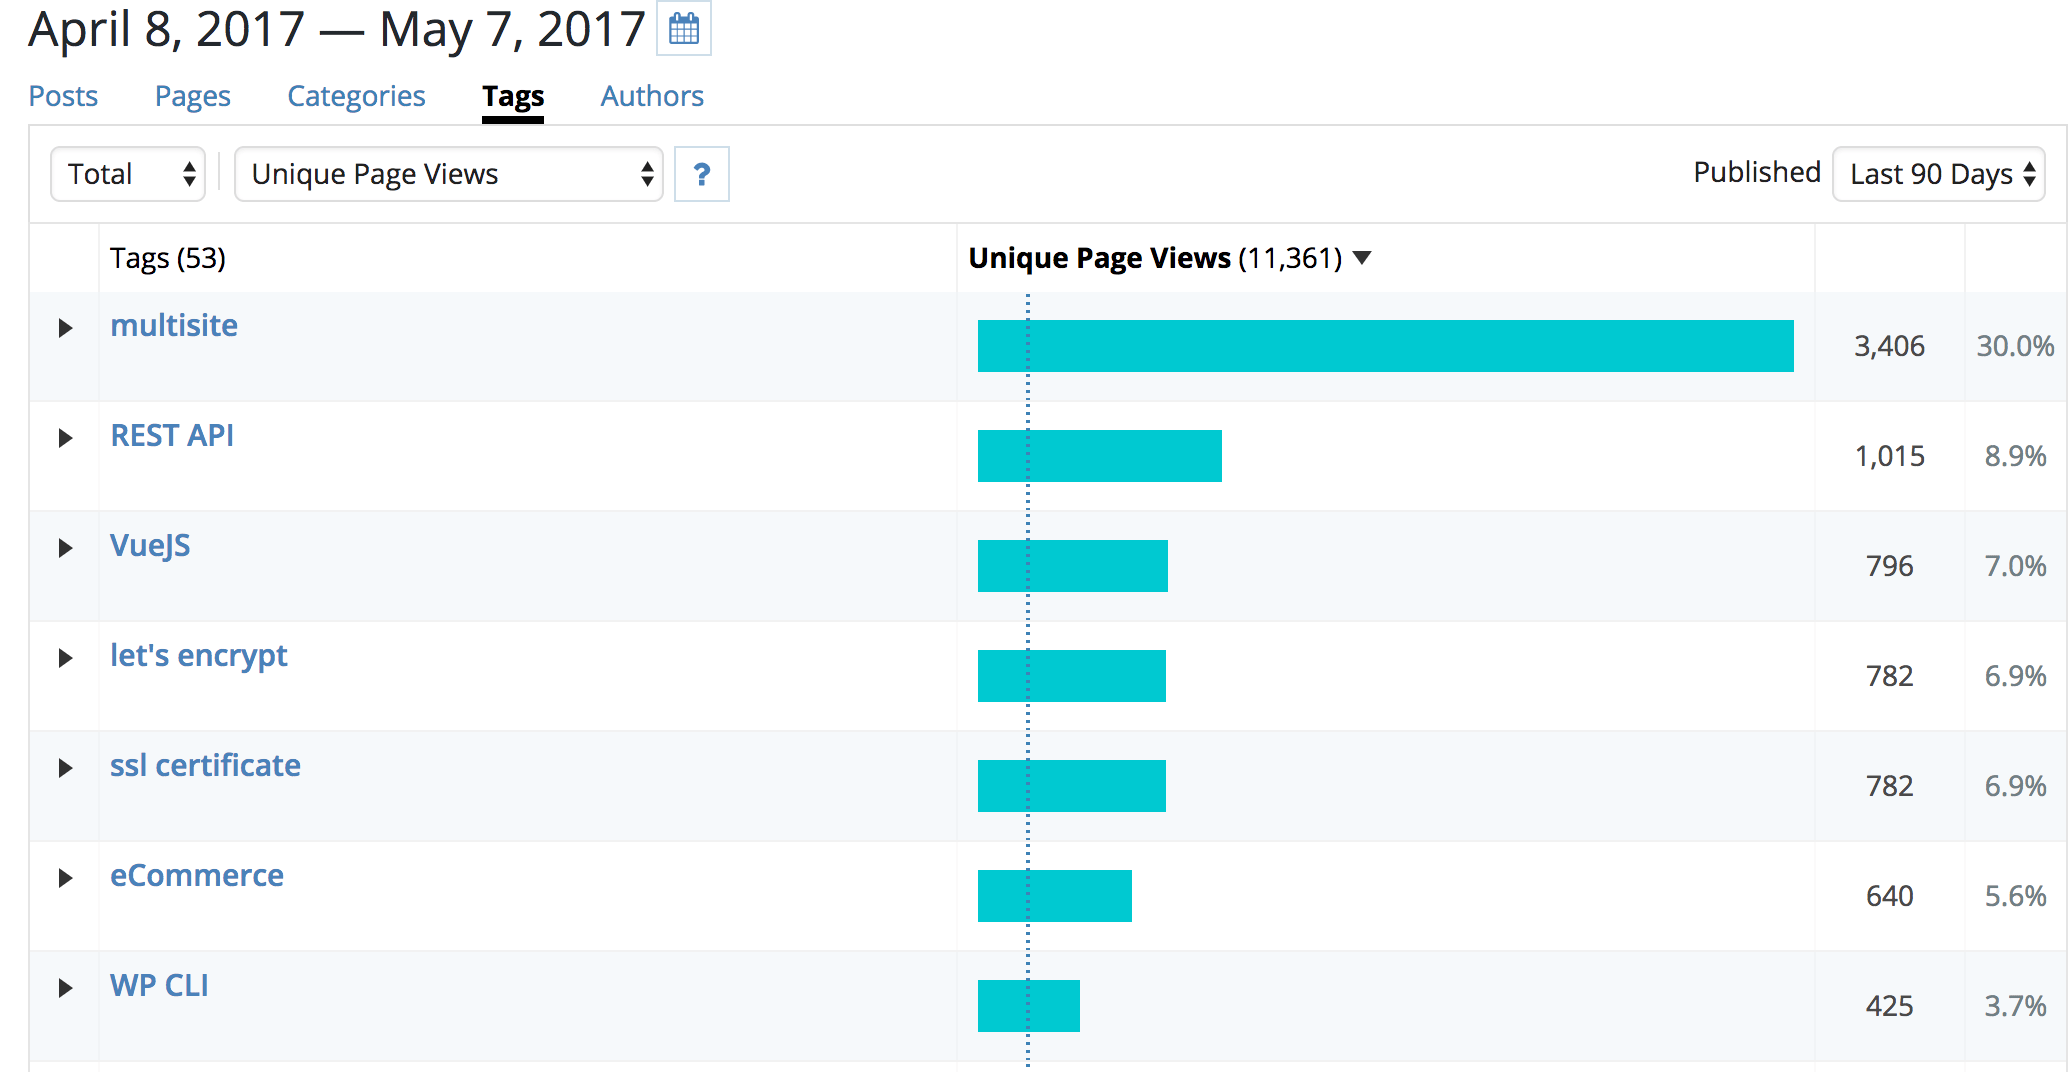
Choose “Tags” in the top navigation, then “Unique Page Views” to see which tags used on pages are driving more views, or which content topics are most popular.
For each report you run, you can download the report as a CSV to generate your own graphs and integrate into your own data as needed.
Custom Post Types
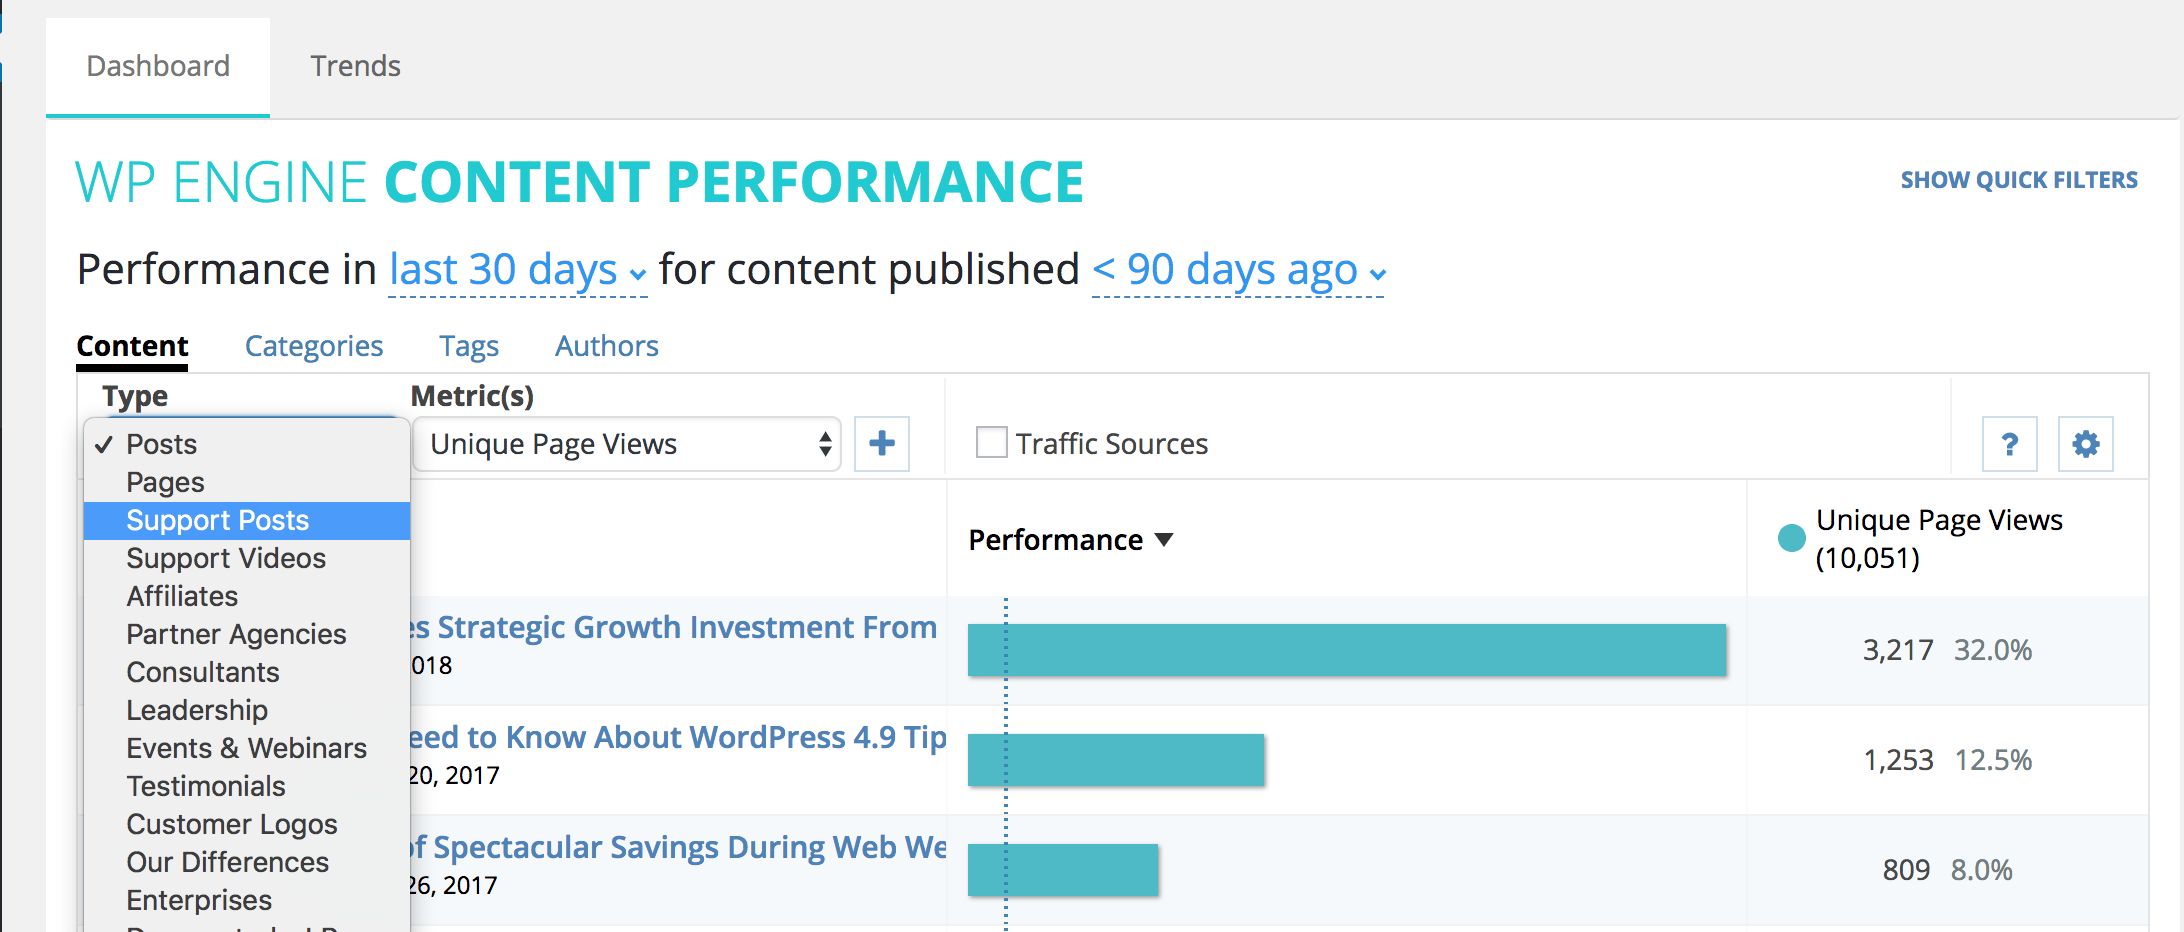
Choose the type of post you would like to view from the “Type” dropdown menu if you would like to view aggregate performance data for posts classified as a “custom post type.” To view only standard posts, choose “Posts” (default).
View Traffic Sources
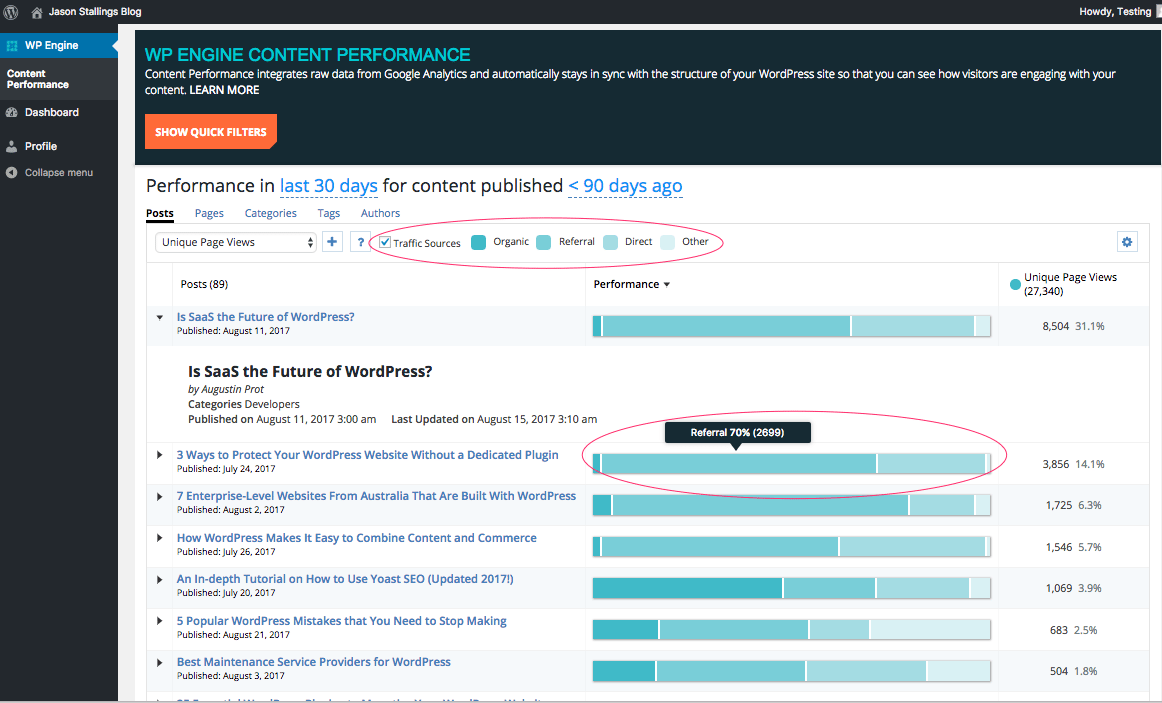
Select the “Traffic Sources” checkbox to view the origin of the traffic to each post on your site. This feature sorts traffic into four categories: Organic, Referral, Direct, and Other.
Organic: This refers to search engine traffic, indicating users are getting to this page by clicking a link on a search results page.
Referral: This refers to traffic referred from other websites. This includes social media sites like Facebook, Pinterest, LinkedIn, and Twitter.
Direct: This refers to traffic that came from users typing the URL in their web browser, going to the site via a bookmark, or clicking an external link from an email, text message, or a PDF.
Other: This refers to traffic from paid advertising and custom campaign channels, as well as unidentified channels
This feature can help your team identify the success ratio of various campaigns, and how to effectively invest marketing funds. Since Traffic Sources identifies the sources of traffic to your site, this additional insight is invaluable to marketers to better understand their audience.
Compare Secondary Metric
Choose to compare two metrics side-by-side. Simply click the “+” sign next to the first metric drop-down menu, and select a second metric to compare. Once you make a selection, it will show your results for both metrics.
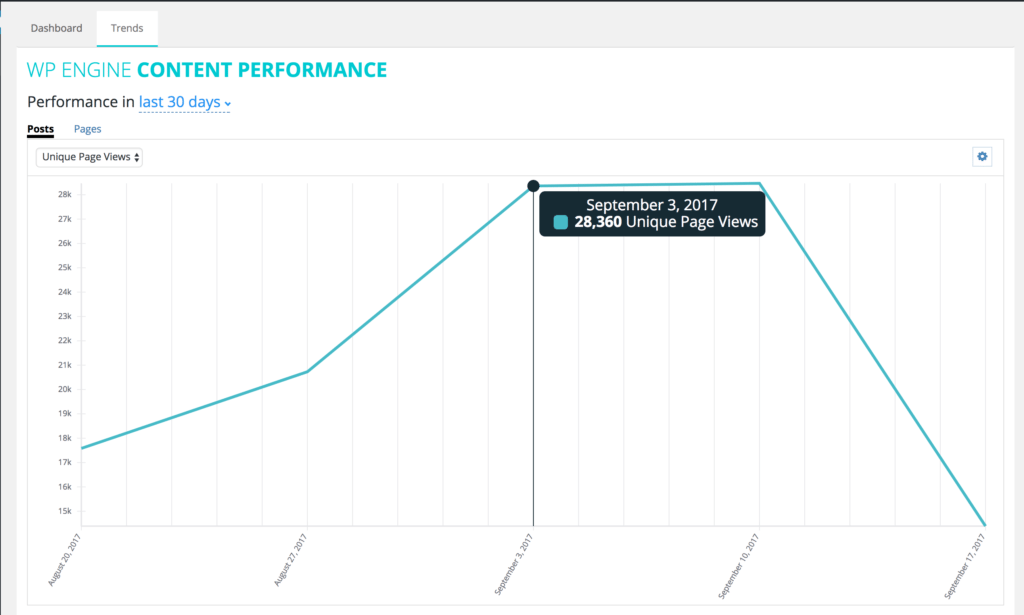
Weekly Trends
Select the “Trends” tab to view a graph showing week-over-week performance for metrics. Sort by Unique Page Views, Page Views, Users, New Users, and Sessions.
Content Performance Term Glossary
The terms below are used in the charts and menus of the Content Performance Dashboard. This glossary will help you understand which metrics relate to which data found within Google Analytics, for a better understanding of how the data in the dashboard is being generated.
Content Performance Metric | Google Analytics Metric | Description |
| Unique Page Views | ga:uniquePageviews | The number of sessions during which the specified page was viewed at least once. Note: A unique page view is counted for each page URL and page title combination. |
| Page Views | ga:pageviews | The total number of page views for the property. |
| Users | ga:users | The total number of users |
| New Users | ga:newUsers | The number of new users to visit the property. |
| Sessions | ga:sessions | The total number of sessions. Note: Google Analytics only computes this value for the first page entered in a session. Consider using Unique Page Views as a proxy to get an accurate count of sessions for your selected report filters. |
| Bounce Rate (%) | ga:bounces / ga:sessions | The percentage of single-page sessions (i.e., sessions in which the user left the property from the first page visited). Note: Bounce rate can be impacted by other events, such as live chat or video auto-plays. Consider setting these events as “non-interaction.” Otherwise, the way Google Analytics computes bounces and sends multiple engagement hits might lead to lower bounce rates than actuals. |
| Page Views per Session | ga:pageviews / ga:sessions | The average number of pages viewed during a session, including repeated views of a single page. |
| Avg. Time on Page (h:m:s) | ga:timeOnPage / (ga:pageviews – ga:exits) | The average time (in hours, minutes, and seconds) users spent viewing a page or a set of pages. |
| Avg. Session Duration (h:m:s) | ga:sessionDuration / ga:sessions | The average duration (in hours, minutes, and seconds) of users’ sessions. |
| Avg. Unique Page Views per Post | N/A | The number of unique page views for the property divided by the sum of the number of published posts for the selected dimension. |
| Avg. Page Views per Post | N/A | The number of page views for the property divided by the sum of the number of published posts for the selected dimension. |
| Avg. Users per Post | N/A | The number of users for the requested time period divided by the sum of the number of published posts for the selected dimension. |
| Avg. New Users per Post | N/A | The number of new users to visit the property divided by the sum of the number of published posts for the selected dimension. |
| Avg. Sessions per Post | N/A | The total number of sessions divided by the sum of the number of published posts for the selected dimension. |
Compatibility and Troubleshooting
In the process of installing, configuring, and using the plugin, you may run into questions about what sites are compatible with Content Performance, or what specific messages may mean.
For a full list of compatibility requirements, information about messaging in the Dashboard and Settings pages, and troubleshooting steps should you encounter any errors, please see Troubleshooting Content Performance.
Additional Resources
To better understand how Google Analytics gathers data and how to improve performance on these metrics, please see the following resources: